
Social welfare 2025: why the new map is no savings league table
The FSO reports 2.9 percent of the population on social assistance. The municipal map shows regional differences, but a change of method and differing population structures limit hasty comparisons.
Switzerland has a new social assistance map – and a modernised basis for the figures behind it. The Federal Statistical Office (FSO) published the results for 2025 on 27 October 2026. Nationwide, around 267,300 people received economic social assistance; the reported rate is 2.9 percent. The interactive map gives the unrounded figure of 267,263 persons.
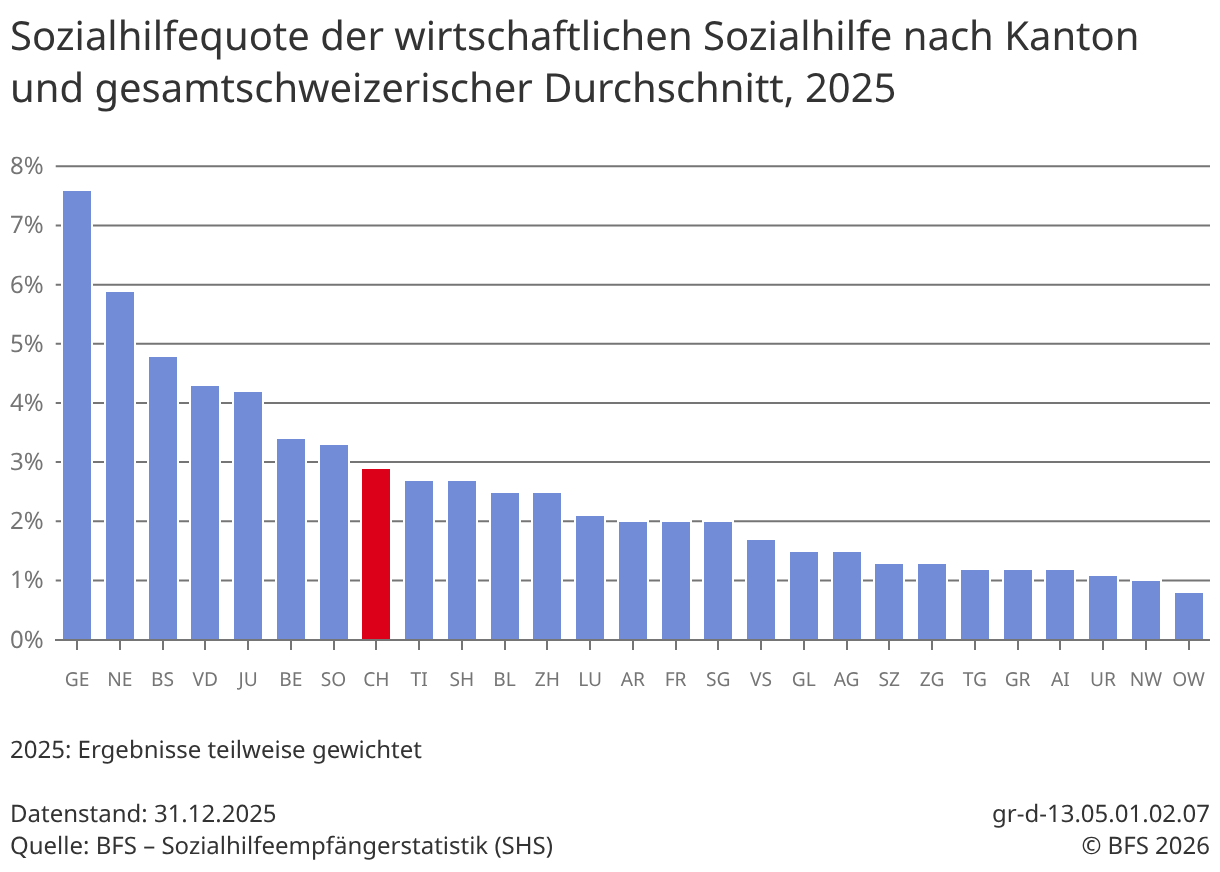
Anyone who turns this into a league table of successful and unsuccessful cantons, however, reads more into it than the presentation supports. The spatial level itself is a different one: the underlying dataset shows political municipalities. For the cantonal comparison, the FSO publishes a separate chart. Both perspectives are useful, but they are not interchangeable.
A large number is not automatically a high rate
The municipal map combines two pieces of information. The size of the circles stands for the number of people supported. Their colour indicates the social assistance rate, that is, the share of the population used for the calculation. A large urban centre can therefore have many recipients without topping the rate ranking.
For municipalities with between one and five supported persons, the FSO does not show the corresponding figures for data protection reasons. A small number that is not displayed must therefore not simply be read as zero. A comparison based only on the visible circle size would also ignore population size.
The stated reference date is 31 December 2025. The publication describes benefit receipt in the reporting year, not a new survey of the situation in October 2026. Precisely when a map is shared as if it were current, this time limit should remain visible.
Why the year-on-year increase calls for caution
According to the FSO, the reported number of supported persons is 4.5 percent above the previous year's figure. At the same time, the rate is at a comparable level. This is neither a contradiction nor firm proof of a correspondingly severe social deterioration. The FSO explicitly warns against unadjusted comparisons over time.
Since the completed modernisation project, monthly administrative data from around 1000 suppliers have been processed largely automatically. The federal government now determines benefit receipt according to uniform rules, handles multiple records more coherently and calculates rates on a revised basis. This improves comparability between places, but it also changes the statistical basis.
Because the switchover took place in stages, complete earlier monthly data were not available throughout for individual suppliers. In the annual evaluations, such introductory effects are offset with statistical weightings. Changes can therefore contain both genuine developments and recording effects. The map does not provide an exact split between these two components.
Regional differences still need explaining
According to the FSO, the familiar pattern persists: several western Swiss cantons and Basel-Stadt have higher rates, while rural central and eastern Swiss cantons often have lower ones. The authority points among other things to economic and population structure and to the particular burdens on urban centres. That is a classification, not a complete breakdown of all differences.
A cantonal average can also conceal large differences within a canton. This is precisely where the municipal map has its value. It allows spatial concentrations to be examined more closely, without already concluding which individual policy measure caused them.
The Conference of Cantonal Social Directors (SODK) describes social assistance as the last safety net when a person's own means and upstream benefits are insufficient. Regulation, organisation and financing are shaped by the cantons; implementation often lies with the municipalities. The rate measures recipients, not the total cost of this net or the quality of its counselling.
Likewise, a rate figure does not show how large the financial gap of a supported person is. A top-up to an existing income and comprehensive subsistence support both appear as benefit receipt. For a budget debate, the amount and duration of support are therefore also relevant.
What a political assessment would additionally need
Poverty and social assistance receipt are not the same thing either. In its sustainability report, the Canton of Aargau notes that non-take-up can have various reasons, including shame, information gaps and legal and administrative hurdles. The canton does not report its own current estimate of non-take-up there.
A serious assessment would therefore have to ask more than which bar is lowest: do benefits reach those entitled to them, how long do situations of need persist, and is financial independence achieved? The new statistics improve the basis for such questions. They do not answer them on their own. For Swiss municipalities, that is an invitation to analyse more closely – not to a hasty victory ceremony.
Sources
- FSO: municipal map on economic social assistance 2025
- FSO: Social assistance 2025, media release with methodological notes
- FSO: social assistance rate by canton and Swiss average 2025
- SODK: tasks, responsibility and financing of social assistance
- Canton of Aargau: non-take-up and limits of the available data
- FSO: OPEN-BY terms of use for the original graphic
- Header image: Hadi / Wikimedia Commons
- Header image licence: CC0 1.0

